Investigating the date range of your files with Pivot Tables
Introduction
It may be that you are interested in the history of your files. Or it could be that you have received a few (thousand) files from a client or third party, and you want to see what sort of information you have available.
It can be important. In one job I received three CDs full of correspondence in jpeg form, which was said to represent a date range of about 2 years. After looking at the information there, I found out that actually there was about 2 months missing in the middle, and I had to request that that be re-sent. Without finding out about this gap, I might have thought that we had all of the information.
In this second of this series of articles on examining your data (read the first article), we look at three ways to start to investigate:
- If you are using either Filecats Standard or Filecats Professional, then there are filtering and Pivot Tables.
- If you are using either Filecats Explore or Filecats Metadata, then there is a built-in date analysis. Scroll to the bottom of this article for more details.
Option 1 - Filtering (for Excel)
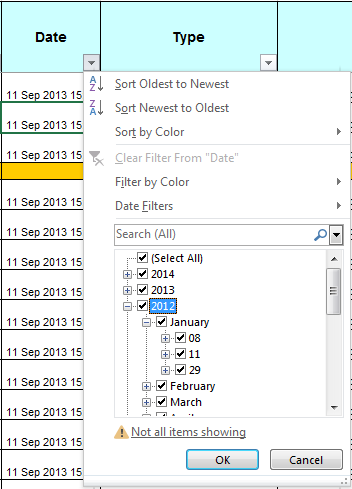
The presentation of filtering options in Excel 2007 and later are significantly improved from earlier versions. You can now drill down into years, months and days and more without having to show the results.
There you will be able to see (if you look hard enough) any gaps. In this example, you can see that there are no files in 1-7, 9, 10, 12-28, 30 or 31 January.
Unfortunately, as you can see, this does not tell you have many files are in each date range, and you would have to complete the filter on each one to find out, so it is of limited use in taking a broad lock at your data.
For more information on how to use it, see this article on filtering.
Option 2: Pivot Table (for Microsoft Excel)
This for me is one of the easiest ways to take a step back and see what we have.
The process for creating a Pivot Table in five easy steps with accompanying screenshots is covered in this article “How do I create a PivotTable?” In summary, highlight the data (or just one cell, if it is formatted like a table), and go to Insert – PivotTable, and then add your rows and values.
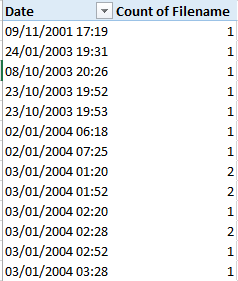
In this example, I have done that for (Count of) Filename for the Value, and for the Rows the metadata field “Date”, which as this article on the difference between system and metadata dates shows, is more reliable than what is shown in Windows Explorer.
However, it’s a bit of a mess:
- Not only is each date shown on a separate line, but
- each second of that date where a file exists is shown on a separate line.
Let’s improve that.
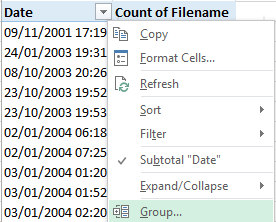
To group it by Months, right-hand click on a date in the PivotTable and select “Group…”. Note, right-hand click on a date – not a value, and not a header – that’s important.
(You can also do making sure your cursor has selected a date in the PivotTable, and going to PivotTable tools – Analyze – Group Field.)
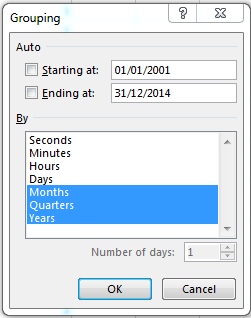
A new dialog box appears, asking over what interval we want to group the data (days, months, quarters, years), and when on which dates should the grouping start and end.
If I want to group by weeks, then I would select Days and say “Number of days: 7”.
In my example, I want to group by Year, then Quarter, then Month, starting in 2001 and going through to 2014.
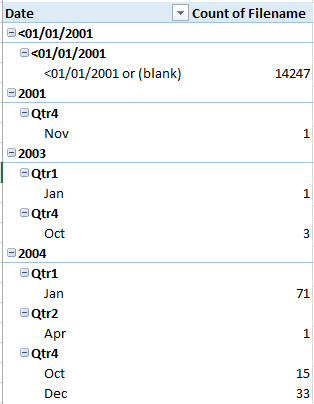
After clicking OK, I now have this table as shown on the right.
It’s going in the right-hand direction, but it’s not showing me much of an overview – whilst all of the files have now been grouped by month instead of by second, it’s still showing me too much detail than I want to start with.
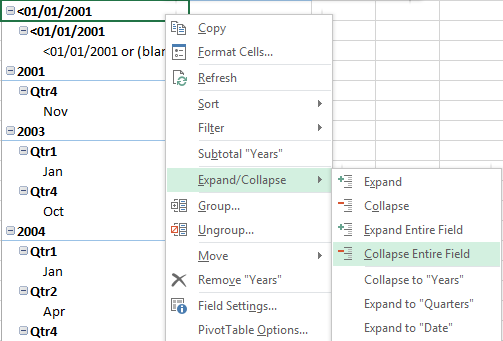
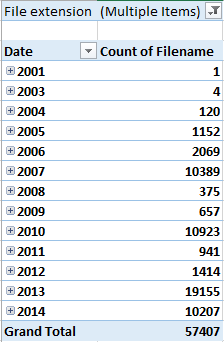
Now I right-click on the first date and go to Expand/Collapse – Collapse Entire Field, and look what happens…
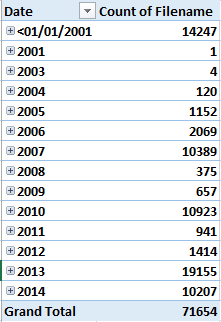
That’s better.
Now at a glance I can see that we might be missing information from 2008, 2009, 2011 and 2012, assuming that the files that we have in 2007, 2010, 2013 and 2014 represent a more realistic view of what we should have.
Note that there is also a plus sign next to each of the years.
Clicking this breaks the year down into quarters and months, which we previously grouped by. Also note that double-clicking on any of the values opens another spreadsheet in that workbook, and shows all the items for that category.
For instance, if I clicked where the “21” is, I would have a new spreadsheet with a header row and 21 rows underneath it.
You may be curious as to why there are 14,247 files with a date range of “<01/01/2001”.
Well, if you noticed above, it also said “or blank”. These files don’t have a metadata date (although they do have System dates) – in fact, they aren’t even files; they’re folders.
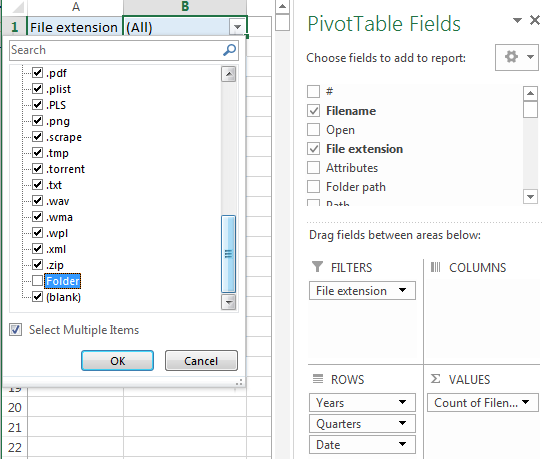
To exclude them, we can drag the “File extension” property into the Filter area, and then exclude Folders by going into the new drop-down list, checking “Select multiple items”, and de-checking “Folder”.
Even better. Now all of these folders are excluded and we are left with the files. This is also a way of concentrating on (say) Microsoft Office documents and excluding all the others.
This sort of grouping is not just limited to dates – you can also do it for numbers and, to some extent, text as well.
Option 3 - Analysis (in Filecats Explore or Filecats Metadata)
Filecats Explore and Filecats Metadata have a built-in date analyais.
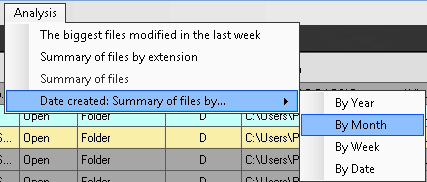
- Click a cell in the column you want to analyse. In this case I will use "Date created".
- Select Analysis - Summary of files by...
- Then select either "By Year", "By Month", "By Week" or "By Date".
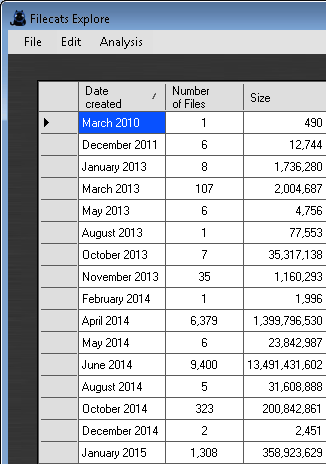
And that's it! A table will be created showing a summary of the files in date order, grouped together either by year, month, week or date.
If you want it in order of number of files or total file size, then click that column either once or twice.
Because Filecats' programs are open-box, you can easy copy and paste this table into your applications.
What next?
How quickly did we get this table? We just created the PivotTable, then added the grouping. How much time could you save with your file analysis using this technique?
In the next of this series of articles, we’ll continue this analysis and look at making it more graphical and adding interactivity.
Do you have any comments? Please leave them below.
If you would like to try out creating a Pivot Table with your catalog, then why not download Filecats Standard and/or Filecats Professional. There’s a 7-day free trial.
Next Article
In the next of this series of articles, we’ll continue this analysis and look at making it more graphical and adding interactivity.